Automotive manufacturers face constant pressure to stay profitable as supply chains shift, labor pools shrink, and costs climb. Now, manufacturers are seeking to adopt automation to enhance efficiency, minimize downtime, and maintain performance in a rapidly evolving market.
By approaching automation as an investment rather than an expense, companies can achieve measurable returns that strengthen their competitiveness. This article explores how to evaluate the ROI of automation in automotive manufacturing, identify high-impact opportunities, and turn automation into a driver of both resilience and growth.
From Pressure to Performance
Turning to automation isn’t as simple as recognizing a problem. Leading manufacturers often hesitate due to uncertainty about the costs and benefits, despite increasing market pressure.
The key is to pivot from a reactive stance to a proactive automation strategy focused on performance. Instead of bracing for the next workforce gap or cost spike, the conversation shifts to what tangible improvements automation can deliver.
Moving from pressure to performance means treating automation as a deliberate investment aimed at measurable gains. With a structured ROI framework, companies can validate that automation will ultimately pay for itself. The approach outlined here will help manufacturers, suppliers, and assemblers in automotive sectors more fully understand how automation can combat today’s economic pressures with improvements backed by performance data.
The Current Industry Reality: Why ROI Matters More Than Ever
Automotive manufacturers face a perfect storm of increasing material costs, competition, tariff uncertainty, and supply chain disruptions.
For example, new U.S. import tariffs of 25% on some automotive parts have raised production costs by an estimated 7 to 12% per vehicle. Global supply chain turbulence, from trade wars to component shortages, continues to disrupt production schedules and drive up costs.
Additionally, labor costs are surging. In the U.S., recent union agreements led to roughly a 25% wage increase for OEM workers, and skilled labor is still hard to find. This combination of tariff turmoil and increased labor costs squeezes profit margins across the industry.
As a result, OEMs and suppliers are tightening their capital budgets and scrutinizing every investment. Any new automation project must clear a high bar for approval by demonstrating tangible cost savings or efficiency gains. This makes manufacturing ROI the key metric.
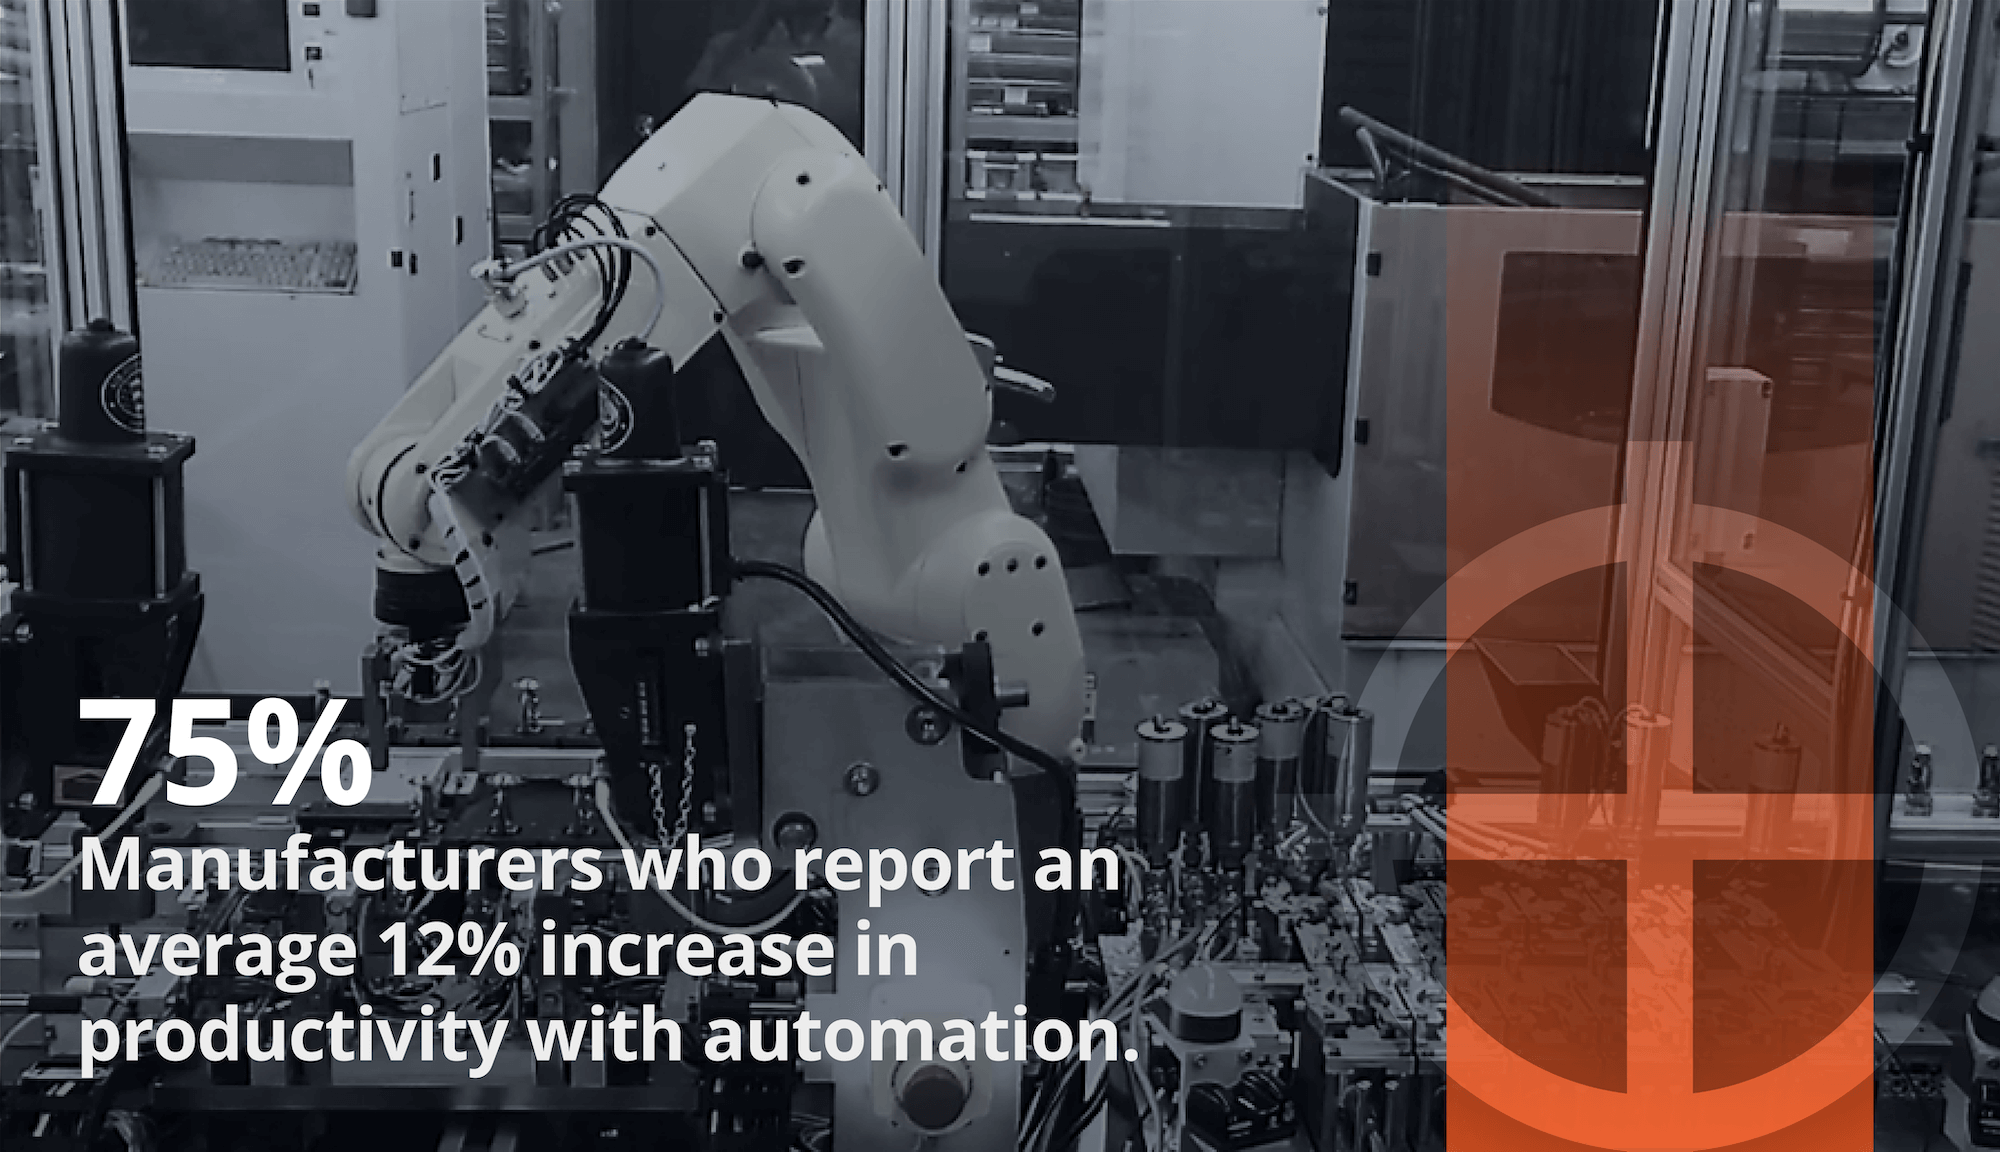
Industry benchmarks indicate that approximately 75% of manufacturers implementing automation experience about a 12% increase in productivity on average, a boost that OEMs and suppliers can’t ignore when margins are under pressure.
Every automation project must answer one question.
What measurable performance advantage will it deliver?
If an initiative doesn’t clearly contribute to industrial automation ROI, it won’t get funded.
This reality forces firms to perform detailed ROI calculations and prove how automation will improve output, quality, or cost structure before green-lighting the project.
ROI is more than a finance exercise; it has become the language by which automation proposals live or die in the automotive world.
The Automotive Automation ROI Framework
To ensure automation initiatives are worthwhile, it’s critical to evaluate them with a structured framework. The Automotive Automation ROI framework (AAROI) provides a structured approach to assess an automation project’s value across the supply chain, from raw material processing to final assembly.
Instead of looking at automation in isolation, AAROI considers all the areas where it impacts costs or revenue. Essentially, it’s a cost-benefit analysis of automotive automation projects tailored to our industry’s specifics.
At its core, ROI (Return on Investment) is a simple equation:
ROI = (Annual Benefit – Annual Cost) / Investment Cost.
It is expressed as a percentage or as a payback period. But a proper automotive automation ROI evaluation goes deeper than just labor saved versus robot cost. We need to quantify the immediate, direct returns and the indirect, sometimes hidden returns of automation.
Breaking Down the Numbers
- Immediate Returns: These include labor cost reduction, increased production throughput, and lower defect rates. For example, if an automated assembly cell can do the work of three people, the direct labor savings are part of the ROI. Likewise, if automation enables you to produce more units per day, the extra revenue or avoided overtime is a direct benefit.
- Indirect Returns: These are benefits that may not show up on day one’s balance sheet, but still have a financial impact. Consider indirect benefits of automation such as reduced unplanned downtime, improved safety (i.e. fewer accidents or injuries), enhanced quality, compliance and traceability improvements, and even customer satisfaction. For instance, automating quality checks might reduce warranty claims next year. A cost avoidance is an indirect ROI component. Automation can also ensure regulatory compliance and improve consistency, which protects future business.
Using this approach, the AAROI framework makes sure you’re counting all the ways automation adds value. It prompts you to measure baseline metrics, such as current cycle time, defect rate, and labor hours per shift, and then estimate the manufacturing productivity improvement and cost changes after automation. It also considers the automation investment costs: not just equipment price, but integration time, training, maintenance, and so on. With AAROI, an automotive firm can compare different projects objectively and prioritize those with the strongest factory automation ROI.
A formal ROI framework does more than validate investment. It aligns teams around one goal: delivering measurable performance through automation. The conversation shifts from “Automation is cool” to “Automation will save us ${X} or improve Y by Z% within 12 months.”
Decision-makers must translate the potential of automation into results. These ROI dimensions help teams prove impact before the first dollar is spent.
Core ROI Dimensions
To justify investment, leaders in automotive manufacturing must evaluate automation based on measurable performance. That means identifying where it delivers the greatest financial and operational impact, from labor savings to throughput gains. Here’s where automation earns its keep, and the performance improvements you can expect.
- Labor Efficiency & Cost Savings: This is often the most immediate benefit. Automation can perform high-repeatability tasks with far fewer people. Manufacturers commonly see a 30–60% reduction in manual work hours on tasks that get automated. That translates to significant labor cost savings through automotive automation.
- Downtime Reduction: Unplanned downtime is the enemy of production efficiency and profit. AI-driven predictive maintenance solutions are a prime automation tool here. By monitoring equipment and predicting failures, they can prevent roughly 30–50% of unplanned downtime. In automotive plants, reducing downtime with AI means keeping the lines running and avoiding extremely costly delays.
- Quality Improvement & Defect Reduction: Automation brings consistency that is hard for purely manual processes to match. Quality control automation can catch defects in-process and ensure only good parts move forward. This can reduce defects by 30–50% in many machining and assembly processes.
- Throughput & Cycle Time Increase: Automating repetitive assembly or handling tasks often improves production time by 20–30% for those processes. Robots and automated machines don’t take breaks, and they operate at consistent speeds 24/7 if needed. By improving assembly line efficiency with robotics, you can produce more units per shift.
- Safety and Ergonomics: Removing humans from hazardous, dirty, or physically demanding tasks offers significant benefits. Fewer injuries and accidents mean less downtime, lower workers’ compensation costs, and even reduced insurance premiums. From an ROI standpoint, consider that each avoided injury saves direct medical and legal costs, and also prevents the indirect costs of lost productivity and hiring and training a replacement.
- Energy & Material Efficiency: Modern automation helps cut energy usage and reduce material waste, contributing to ROI. Automated equipment can be programmed to optimize its energy consumption, for instance, powering down when idle or using efficient motion planning. With consistent quality, automation avoids raw materials waste.
Each of these dimensions–labor, downtime, quality, throughput, safety, and efficiency–forms part of the industrial automation ROI equation. The best automation projects deliver measurable gains across multiple measurements and dimensions. When building the business case, make sure to capture gains across all relevant categories, not just one. That provides a fuller picture of automation’s benefits.
ROI Opportunities by Process Area
| Process Area |
Typical Application |
ROI Potential |
Example Benefit |
|---|---|---|---|
| Predictive Maintenance | AI diagnostics for CNC/robot uptime | 30–50% downtime reduction | Improved operational availability |
| Interior Assembly | Precision joining and testing | 20–30% faster cycles | Lower reject rates for premium interiors |
| Wiring/Harness Tooling | Automated wire prep, crimping | 40–60% labor cost savings | Consistent precision on complex harnesses |
| Machining Defect Detection | Inline metrology, vision inspection | 30–50% fewer defective parts | Tool longevity, lowered scrap costs |
Costs and Externalities: The Hidden ROI Story
Not every automation project is a slam dunk, and even successful ones have costs that need to be managed. A comprehensive automation evaluation must account for everything that affects ROI. That means accounting for downstream effects, indirect costs, and operational tradeoffs.
- Integration and Downtime Risk: Installing new automation can cause temporary disruption. If you underestimate the complexity of commissioning a robot or integrating a new system, you might face extended downtime or debugging costs that erode ROI. For instance, an in-line vision system that initially overloaded their network, causing unplanned downtime that cost thousands per minute.
- Underutilized Automation: Buying more automation capacity than you can use is another pitfall. Sometimes systems are so advanced or fast that they sit idle waiting for upstream or downstream processes. If you install a robot that could produce 100 parts per hour but your current order volume only needs 50, you’ve essentially paid for capability you’re not using, which drags down the ROI. Similarly, if automation isn’t scaled correctly, you don’t get full value.
- Opportunity Cost of Inaction: Decision-making often centers on the cost of doing automation while ignoring the cost of delay. For example, keeping a manual process with a 5% scrap rate might cost more over a year than the automation system that would eliminate it. Labor shortages, quality issues, and missed delivery deadlines also incur financial penalties, even if not reflected in the budget. When evaluating ROI, it is essential to include the costs automation helps you avoid.
- Technology Obsolescence: Delaying modernization can be costly. Outdated equipment may become incompatible or unsupported, while competitors gain efficiency with newer systems. A plant running on 20-year-old machinery might need a significant capital infusion to catch up. Older lines also limit innovation, making it harder to adapt products or win new business. Part of the ROI case for automation is future-proofing. By investing now, you reduce the risk of having to rebuild half your factory later at a much higher cost.
The takeaway: A robust automation ROI analysis considers the gains and the potential hidden costs. Leaders who factor in integration, utilization, opportunity cost, and long-term viability gain a clearer picture of ROI, including what it prevents tomorrow. This well-rounded view prevents surprises and builds confidence among stakeholders.
Recognizing the Signs It’s Time to Automate
Even knowing the benefits, it’s not always clear when to pull the trigger on an automation project. Many shop owners and managers ask: “How do I know if we’re ready or need to automate?” There are common signs in your operations that signal it’s time to seriously consider automation.
The Tiered ROI Perspective
Automation isn’t one-size-fits-all across the automotive supply chain. An OEM has different priorities than a Tier 1 or Tier 2 supplier. Let’s break down how ROI considerations might change depending on where you sit in the automotive ecosystem.
| Tier | Primary ROI Focus |
Key Automation Priorities |
ROI Drivers & Benefits |
Example / Outcome |
|---|---|---|---|---|
| OEMs | Throughput, consistency, reliability | • Predictive maintenance • Integration with MES & traceability systems • Flexible robotic cells |
• Avoid costly downtime • Enable mass customization • Improve quality control at line speed • Scale rapidly for new models |
• Flexible robots reprogrammed per model avoid costly retooling. • Build 15% more cars per week with the same line. |
| Tier 1 Supplier | Quality, uptime, delivery performance | • Automated assembly and testing • Vision inspection systems • Automated traceability |
• Higher FPY (first-pass yield) • Fewer OEM line stoppages • Reduced rework & scrap |
• Vision inspection + robotics → 20% productivity gain. • FPY improved 92% → 98%, ensuring contract retention. |
| Tier 2 & Tier 3 Suppliers | Efficiency, uptime, cost competitiveness | • Sensor-based monitoring • Simple robot loaders • Automated inspection (machine vision) |
• Lower scrap and material waste • Higher machine utilization • Consistent quality for Tier 1/OEM demands |
• A $100K robot enables lights-out CNC, yielding $200K/year extra production. • Machine vision cuts defects significantly. |
| Equipment / Tooling Suppliers & Automation Vendors | Proving value & performance to end-users | • IoT connectivity • Easy integration with factory data systems • Reliable, data-backed machines |
• Demonstrate payback & performance data • Strengthen customer ROI case • Align solutions to business outcomes |
• Vendor can claim: Pays for itself in 18 months for Tier 2 applications. • Partnership-driven ROI alignment builds long-term success. |
Evaluating and Achieving ROI with Automation
Understanding ROI conceptually is one thing. Achieving requires clear benchmarks and smart execution.
Here’s a step-by-step guide to evaluating, implementing, and ensuring ROI for an automation project in automotive manufacturing.
- Baseline Assessment: Measure cycle times, defect rates, downtime, and labor costs. If you don’t know your starting point, you can’t prove progress.
- Technology Fit Audit: Start with the problem. Identify what’s slowing you down, then match it with automation that solves it cleanly and scales with your operation.
- Phased Implementation: Begin with a small, high-impact win. Use early results to refine the approach and fund the next phase.
- Lifecycle Monitoring: ROI is not a launch metric. Track your performance against your baseline, adjust as needed, and continue to improve. Automation should continue to deliver.
- ROI as Culture: Treat automation as a long-term strategy. When each project builds on the next, you create momentum, capability, and a competitive advantage.
Custom Automation Solutions
Leverage our decades of expertise to integrate the production automation you need.
Automation Services
The ROI Potential
With numerous automation options available, it is helpful to compare them side by side. Not every solution delivers the same return, and some are better suited for early investment than others. The scoring framework below helps teams make initial ROI assessments based on impact by factoring in cost, labor savings, quality gains, throughput, and flexibility.
The higher the score, the greater the ROI potential (Max 25). Solutions scoring 20 or above offer the highest ROI potential, particularly those that combine labor savings, quality improvement, and adaptability.
This scoring model is just one way to evaluate the ROI of automation. It should be balanced with a deeper review of hidden costs and opportunity costs, including scrap, safety risks, and the long-term expenses associated with delaying automation.
Scoring Notes
- Upfront Cost: Lower scores mean higher cost, which can reduce ROI.
- Labor Savings: Higher scores mean more labor is replaced or redeployed.
- Quality Improvement: Higher scores mean more defects caught/prevented.
- Throughput Increase: Higher scores mean faster production.
- Flexibility: Higher scores mean the solution adapts easily to new products or processes.
| Automation Solution | Upfront ▲▼ |
Labor ▲▼ |
Quality ▲▼ |
Output ▲▼ |
Flexible ▲▼ |
Total ROI ▲▼ |
Score ▲▼ |
ROI Tier ▲▼ |
|---|---|---|---|---|---|---|---|---|
| Vibration Testing | 2 | 2 | 4 | 3 | 2 | 13 | 1.0 | Low ROI |
| Hardness Testing | 3 | 3 | 5 | 3 | 2 | 16 | 1.5 | Low ROI |
| Flow Testing | 3 | 3 | 4 | 4 | 3 | 17 | 2.0 | Moderate ROI |
| Pressure Decay Testing | 3 | 3 | 5 | 3 | 3 | 17 | 2.0 | Moderate ROI |
| Torque Testing | 3 | 3 | 4 | 4 | 3 | 17 | 2.0 | Moderate ROI |
| Contact Measurement | 3 | 3 | 4 | 4 | 3 | 17 | 2.0 | Moderate ROI |
| O-Ring Conveyors | 4 | 3 | 3 | 4 | 3 | 17 | 2.0 | Moderate ROI |
| Eddy Current Inspection | 3 | 3 | 5 | 4 | 3 | 18 | 2.5 | Moderate ROI |
| Inductive Measurement | 4 | 3 | 4 | 4 | 3 | 18 | 2.5 | Moderate ROI |
| Hi-Pot / Dielectric Testing | 3 | 3 | 5 | 4 | 3 | 18 | 2.5 | Moderate ROI |
| Checkweighing | 4 | 3 | 4 | 4 | 3 | 18 | 2.5 | Moderate ROI |
| Conductivity and Resistance Testing | 3 | 3 | 5 | 4 | 3 | 18 | 2.5 | Moderate ROI |
| Thermal Beading | 3 | 4 | 4 | 4 | 3 | 18 | 2.5 | Moderate ROI |
| Riveting | 3 | 4 | 4 | 4 | 3 | 18 | 2.5 | Moderate ROI |
| Step Feeders | 3 | 4 | 4 | 4 | 3 | 18 | 2.5 | Moderate ROI |
| Laser Profile Measurement | 2 | 4 | 5 | 4 | 4 | 19 | 3.0 | High ROI |
| Hot Plate Welding | 3 | 4 | 5 | 4 | 3 | 19 | 3.0 | High ROI |
| Press-to-Set Depth | 3 | 4 | 5 | 4 | 3 | 19 | 3.0 | High ROI |
| Press-to-Set Force | 3 | 4 | 5 | 4 | 3 | 19 | 3.0 | High ROI |
| Mechanical Alignment | 4 | 4 | 4 | 4 | 3 | 19 | 3.0 | High ROI |
| Sorting Verified vs. Rejected Parts | 3 | 4 | 5 | 4 | 3 | 19 | 3.0 | High ROI |
| Sorting Based on RFID Data | 3 | 4 | 4 | 4 | 4 | 19 | 3.0 | High ROI |
| Sorting by Measurement or Grade | 3 | 4 | 5 | 4 | 3 | 19 | 3.0 | High ROI |
| Hi-Pot and Dielectric Testing | 3 | 4 | 5 | 4 | 3 | 19 | 3.0 | High ROI |
| Automated Tool Monitoring | 3 | 3 | 5 | 4 | 4 | 19 | 3.0 | High ROI |
| Vision Inspection | 3 | 4 | 5 | 4 | 4 | 20 | 3.5 | High ROI |
| Ultrasonic Welding | 3 | 4 | 5 | 5 | 3 | 20 | 3.5 | High ROI |
| Spot Welding | 3 | 4 | 5 | 5 | 3 | 20 | 3.5 | High ROI |
| Alignment with Machine Vision | 3 | 4 | 5 | 4 | 4 | 20 | 3.5 | High ROI |
| Custom Flat Belt Conveyors | 4 | 4 | 4 | 5 | 3 | 20 | 3.5 | High ROI |
| Pallet Conveyor Systems | 3 | 4 | 4 | 5 | 4 | 20 | 3.5 | High ROI |
| Wire Cutting and Stripping Machines | 3 | 5 | 4 | 5 | 3 | 20 | 3.5 | High ROI |
| In-Line Inspection & Vision Systems | 3 | 4 | 5 | 4 | 4 | 20 | 3.5 | High ROI |
| Mechanical Assembly | 3 | 5 | 4 | 5 | 4 | 21 | 4.0 | Top ROI |
| Screw Driving | 3 | 5 | 4 | 5 | 4 | 21 | 4.0 | Top ROI |
| Custom Assembly Operations | 2 | 5 | 4 | 5 | 5 | 21 | 4.0 | Top ROI |
| Robotic Machine Tending & Palletizing | 3 | 5 | 4 | 5 | 4 | 21 | 4.0 | Top ROI |
| Integrated Metrology Systems | 4 | 4 | 5 | 4 | 4 | 21 | 4.0 | Top ROI |
| Precision Part Placement | 3 | 5 | 5 | 5 | 4 | 22 | 4.5 | Top ROI |
| Flexible Feeding Systems | 3 | 5 | 4 | 5 | 5 | 22 | 4.5 | Top ROI |
| Bin Picking Solutions | 3 | 5 | 4 | 5 | 5 | 22 | 4.5 | Top ROI |
| Combination Bin Picking with Machining | 3 | 5 | 4 | 5 | 5 | 22 | 4.5 | Top ROI |
| Pick-and-Place Robots for PCBs | 3 | 5 | 5 | 5 | 4 | 22 | 4.5 | Top ROI |
| Wave and Reflow Soldering | 3 | 5 | 5 | 5 | 4 | 22 | 4.5 | Top ROI |
| Crimping and Connector Assembly | 3 | 5 | 5 | 5 | 4 | 22 | 4.5 | Top ROI |
| Robotic Assembly of Electronic Modules | 3 | 5 | 5 | 5 | 4 | 22 | 4.5 | Top ROI |
| Advanced Fixturing & Workholding | 4 | 4 | 5 | 5 | 4 | 22 | 4.5 | Top ROI |
Based on real-world case studies and outcomes
Industry benchmarks and research
Vendor and integrator case studies (Fanuc)
ROI calculation and economic analysis sources
Scoring Logic
1. Real-World Results: Smart factory investments consistently deliver strong ROI. One mid-sized auto parts manufacturer reduced defects by 37%, downtime by 28%, and production costs by 15%, achieving full ROI in just two years. Other studies show defect reductions up to 70% in high-automation plants.
2. Industry Benchmarks: Research shows 75% of companies using industrial automation see a 10–12% productivity boost. RPA in the automotive industry delivers average cost savings of 30% within five years, along with improvements in consistency and flexibility.
3. Vendor Case Studies: Suppliers like FANUC report improved efficiency, reduced labor needs, and better quality through robotics. Examples include higher output, lower waste, and increased profitability from welding cobots, machine tending, and CNC automation.
4. ROI Frameworks: Consultants and industry sources outline ROI models based on upfront cost, labor savings, quality gains, and throughput improvements. These inputs align with the scoring logic used in evaluation.
5. Scoring Criteria
Upfront Cost: Based on typical project expenses and payback timelines
Labor Savings: Supported by case studies and RPA benchmarks
Quality Improvement: Backed by defect reduction data
Throughput Increase: Linked to cycle time and capacity gains
Flexibility: Reflects the adaptability of modular and software-based automation
From Resilience to Return
Leaders in the automotive sector invest in automation to build more resilient and profitable operations. With rising tariffs, labor shortages, and tighter quality demands, automation helps manufacturers control what they can manage when external forces disrupt the rest.
ROI stays front and center.
Every investment should improve performance and sharpen competitiveness.
Companies like PMi2 accelerate that progress. They collaborate with automotive suppliers to identify high-return-on-investment (ROI) opportunities, implement targeted technologies, and deliver measurable results. Their focus stays on business outcomes, not just technical upgrades.
An ROI-focused roadmap supports decision-making, enabling manufacturers to invest with confidence.
FAQs
Key benefits are labor efficiency and cost savings, reduced unplanned downtime through predictive maintenance, improved quality and defect reduction, increased throughput/cycle time improvements, enhanced safety and ergonomics, and better energy/material efficiency.
Beyond immediate savings, indirect benefits include reduced warranty claims, improved customer satisfaction, strengthened brand reputation, regulatory compliance, lower insurance costs, fewer injuries, and future-proofing operations against evolving market demands.
Signs include rising or volatile labor costs, chronic labor shortages, recurring production bottlenecks, high defect rates, excessive material or energy waste, capacity limits, and safety risks for workers.
Labor savings are quantified by calculating the reduction in direct labor hours multiplied by fully burdened labor costs (including wages, benefits, and overhead). Automation projects often track both headcount reduction and redeployment benefits for detailed ROI.
Cycle time analysis measures the time to complete a process or assembly step. Automation typically reduces cycle time by 20–30%, enabling more units to be produced per shift. The increased throughput is translated into incremental revenue or cost avoidance in ROI models.
Integration challenges that affect ROI include system compatibility issues, high network loads, and the downtime required for commissioning new equipment. These challenges can increase costs through the need for additional middleware, network upgrades, and extended system testing, all of which should be factored into ROI estimates.